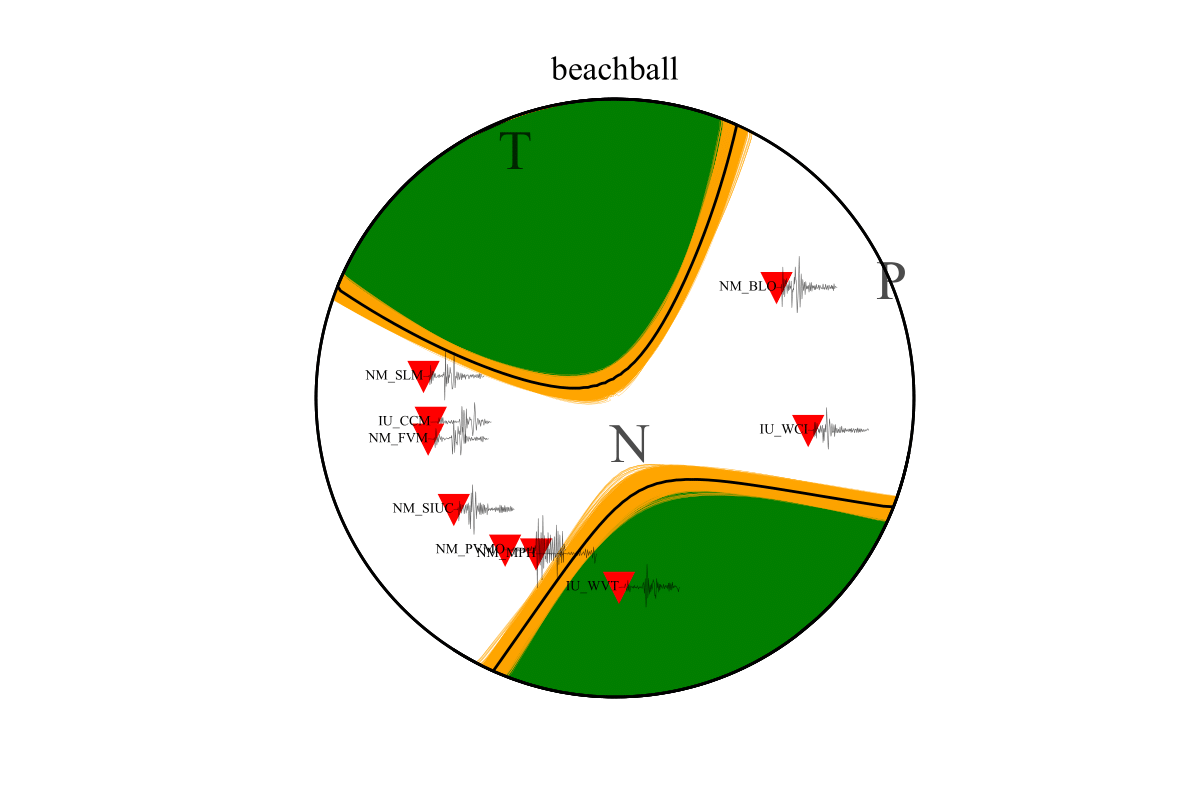
Plot Beachball with Station Projected
The example_path need to de changed to your path, and run this notebook.
  1#!/usr/bin/env python3
  2# -*- coding: utf-8 -*-
  3import os
  4import glob
  5import obspy
  6import numpy as np
  7import matplotlib.pyplot as plt
  8from obspy import Stream
  9from obspy.taup import TauPyModel
 10from obspy.imaging.mopad_wrapper import beach
 11from MCMTpy import MomentTensor as MTpy
 12
 13# Helper function
 14#----------------------------------------------------#
 15#%% 1.read raw data
 16def read_data(allfiles_path):
 17
 18    allfiles = sorted( glob.glob(allfiles_path) )
 19    data_raw = Stream()
 20    for i in range(0,len(allfiles),1):
 21        try:
 22            tr = obspy.read(allfiles[i])
 23            data_raw += tr
 24        except Exception:
 25            print(allfiles[i],': no such file or obspy read error');continue
 26    data = data_raw.copy()
 27
 28    return data
 29
 30#----------------------------------------------------#
 31#%% 2.taup ray trace
 32def get_taup_tp_ts(model,depth,distance,degree=None):
 33    if degree==False:
 34        distance = distance/111.19
 35
 36    time_p = model.get_travel_times(source_depth_in_km=depth,
 37                                    distance_in_degree=distance,
 38                                    phase_list=["p", "P"])
 39
 40    time_s = model.get_travel_times(source_depth_in_km=depth,
 41                                    distance_in_degree=distance,
 42                                    phase_list=["s", "S"])
 43
 44    ray_p = time_p[0].ray_param
 45    tp = time_p[0].time
 46    angle_p = time_p[0].incident_angle
 47
 48    ray_s = time_s[0].ray_param
 49    ts = time_s[0].time
 50    angle_s = time_s[0].incident_angle
 51
 52    return ray_p,tp,angle_p,ray_s,ts,angle_s
 53
 54
 55#%%------------------------------------------------------------#
 56# 0. set path
 57example_path = '/Users/yf/3.Project/8.MCMTpy/MCMTpy-master/data/example_yunnan'
 58
 59
 60#------------------------------------------------------------#
 61# we expect no parameters need to be changed below
 62#------------------------------------------------------------#
 63FM_path=os.path.join(example_path,"YN.202105212148_Inv/dc_inv/Output_YN.202105212148_dc/rank_0_output/chain_0_FM_accept_all")
 64allfiles_path = os.path.join(example_path,'YN.202105212148_Inv/YN.202105212148_raw/*.SAC')
 65
 66## 1. read FM
 67N=3 # Three parameters are required to describe the focal mechanism
 68FM_all = np.loadtxt(FM_path)
 69FM_raw = FM_all[0:,1:N+1] # Define the number of solutions you want to plot
 70strike_np = FM_raw[:,0]
 71dip_np = FM_raw[:,1]
 72rake_np = FM_raw[:,2]
 73FM = np.vstack((strike_np, dip_np,  rake_np)).T
 74FM_mean=np.zeros(shape=(N))
 75for i in range(0,N,1):
 76    FM_mean[i]=np.mean(FM[0:,i])
 77
 78## 2.read raw data
 79data = read_data(allfiles_path)
 80data.filter('bandpass', freqmin=0.005, freqmax=0.5, corners=4, zerophase=True)
 81
 82## 3.ray trace with taup
 83model_path = os.path.join(example_path,"v_model/v_model.npz")
 84model = TauPyModel(model=model_path)    # "iasp91"  "prem"
 85for i in range(0,len(data),1):
 86    depth = data[i].stats.sac['evdp']
 87    distance = data[i].stats.sac['dist']
 88    ray_p,tp,angle_p,ray_s,ts,angle_s = get_taup_tp_ts(model,depth,distance,degree=False)
 89    data[i].stats.sac["user1"]=angle_p
 90    data[i].stats.sac["user2"]=angle_s
 91
 92## 4.1 plot FM_mean
 93ax0 = plt.gca()
 94Length_Ball = 100
 95beach1 = beach(FM_mean, xy=(50, 50),  linewidth=1,width=Length_Ball-1, alpha=1,\
 96               facecolor='g',bgcolor='w', edgecolor='k',mopad_basis='NED',nofill=False,zorder=1 )
 97ax0.add_collection(beach1)
 98ax0.set_aspect("equal")
 99
100## 4.2 plot FM_all
101for i in range(0,FM.shape[0],1):
102    beach1 = beach(FM[i,:], xy=(50, 50),  linewidth=1,width=Length_Ball-1, alpha=1,\
103                facecolor='b',bgcolor='w', edgecolor='orange',mopad_basis='NED',nofill=True,zorder=1 )
104    ax0.add_collection(beach1)
105    ax0.set_aspect("equal")
106
107## 4.3 plot backgroud line
108beach1 = beach(FM_mean, xy=(50, 50),  linewidth=1,width=Length_Ball-1, alpha=1,\
109                facecolor='w',bgcolor='w', edgecolor='k',mopad_basis='NED',nofill=True,zorder=1 )
110ax0.add_collection(beach1)
111ax0.set_aspect("equal")
112
113## 5.plot station and waveform
114menthod='schmidt'   # 'schmidt' 'wulff'
115for i in range(0,len(data),3):
116    AZM = data[i].stats.sac['az']
117    TKO = data[i].stats.sac['user1']
118    net_sta_name = data[i].stats.network+'_'+data[i].stats.station
119    X, Y = MTpy.project_beachball(AZM, TKO, R=Length_Ball/2, menthod=menthod)
120    tt=np.linspace(X, X+10, num=len(data[i].data))
121    ax0.plot(X, Y, "rv", ms=10,zorder=1)
122    ax0.plot(tt, 5*data[i].data/2000000 + Y,  color='black',lw=0.2,alpha=0.6,zorder=1)
123    ax0.text(X, Y,net_sta_name,horizontalalignment='right', verticalalignment='center',\
124          fontsize=5, color='black',bbox = dict(facecolor = "r", alpha = 0.0),zorder=1)
125
126## 6. plot P/T/N axis
127MT = MTpy.str_dip_rake2MT(strike=FM_mean[0],dip=FM_mean[1],rake=FM_mean[2])
128T_axis, P_axis, N_axis = MTpy.MT2TPN(MT)
129T = MTpy.vector2str_dip(T_axis)
130P = MTpy.vector2str_dip(P_axis)
131N = MTpy.vector2str_dip(N_axis)
132
133Tx, Ty = MTpy.project_beachball(AZM=T.strike, TKO=(90-T.dip), R=Length_Ball/2, menthod=menthod)
134ax0.text(Tx,Ty,'T',horizontalalignment='center', verticalalignment='center',\
135          fontsize=20, color='k',alpha=0.7,zorder=1)
136
137Px, Py = MTpy.project_beachball(AZM=P.strike, TKO=(90-P.dip), R=Length_Ball/2, menthod=menthod)
138ax0.text(Px,Py,'P',horizontalalignment='center', verticalalignment='center',\
139          fontsize=20, color='k',alpha=0.7,zorder=1)
140
141Nx, Ny = MTpy.project_beachball(AZM=N.strike, TKO=(90-N.dip), R=Length_Ball/2, menthod=menthod)
142ax0.text(Nx,Ny,'N',horizontalalignment='center', verticalalignment='center',\
143          fontsize=20, color='k',alpha=0.7,zorder=1)
144
145
146## 7. save figure
147ax0.set_xlim(0,100)
148ax0.set_ylim(0,100)
149ax0.set_axis_off()
150figurename=os.path.join('./S2_figure/beachball.pdf')
151plt.savefig(figurename,dpi=800, format="pdf")